参考资料
- Tutorial 01: Say Hello to CUDA - CUDA Tutorial (cuda-tutorial.readthedocs.io)
- 北京大学高性能计算平台 (pku.edu.cn)
docker cuda
问题描述:
在 Docker 中使用 GPU 时遇到驱动版本冲突问题,具体表现如下:
- 官方镜像正常工作:
使用nvcr.io/nvidia/cuda:12.8.0-base-ubuntu22.04+--gpus all时,nvidia-smi能正确显示 CUDA 版本,PyTorch 可调用 GPU。 - 自定义镜像异常:
基于ubuntu:22.04自建镜像时,nvidia-smi显示 CUDA 版本为N/A,PyTorch 报错No GPU driver found。若在镜像内手动安装驱动,则出现NVML driver/library version mismatch(宿主机驱动版本与容器内不一致)。 - 疑问:
- 为何 NVIDIA 官方镜像无需安装驱动(
apt list无nvidia-driver)却能工作? - 如何解决自定义镜像的驱动版本冲突?强制对齐宿主机和容器内驱动的小版本难度大,是否有通用方案?
1. 官方镜像为何无需安装驱动?
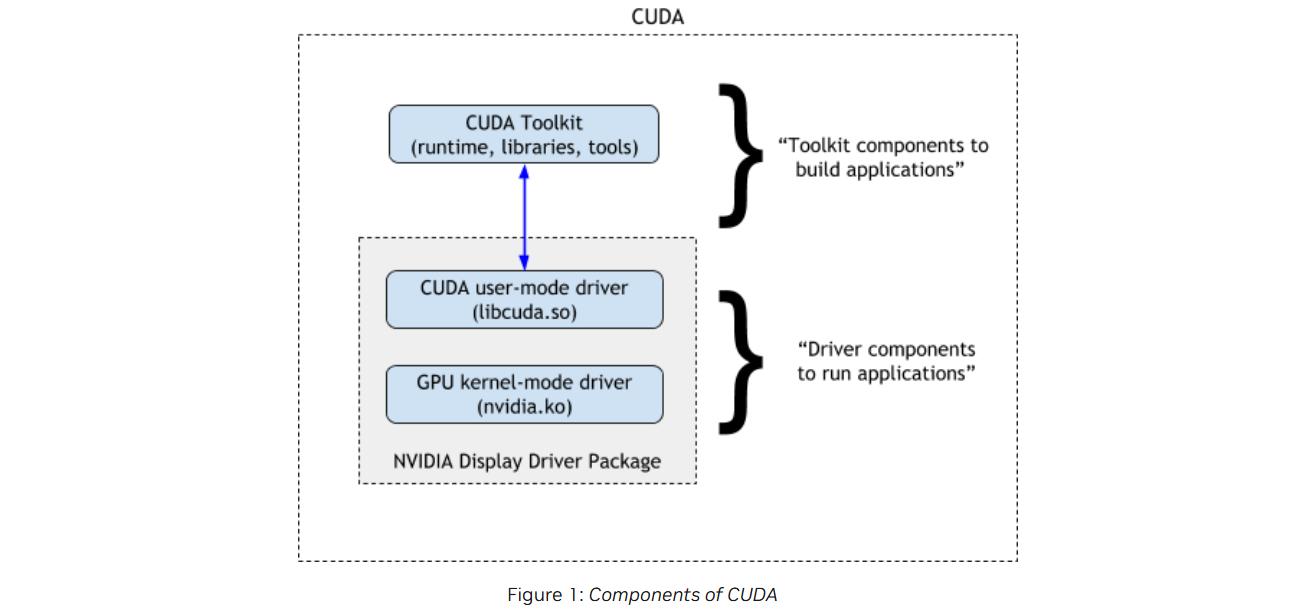
NVIDIA 官方镜像(如 nvcr.io/nvidia/cuda)通过 NVIDIA Container Toolkit 实现 GPU 透传,其核心机制为:
- 挂载宿主机驱动库:容器启动时,自动挂载宿主机侧的 NVIDIA 驱动库(如
libcuda.so、libnvidia-ptxjitcompiler.so)到容器内的/usr/local/nvidia/lib64。 - 环境变量配置:镜像内已设置
LD_LIBRARY_PATH,优先加载挂载的宿主机驱动库,而非容器内自带的库。
查看 nvidia/cuda 镜像的 layer:Image Layer Details - nvidia/cuda:12.8.0-cudnn-devel-ubuntu22.04 | Docker Hub
其中确实大量设置了
然后容器内该目录却并不存在。不过通过 locate libcuda.so 发现确实和自己的镜像不同
➜  ~ dpkg -S /usr/lib/x86_64-linux-gnu/libcuda.so.535.183.01
libnvidia-compute-535:amd64: /usr/lib/x86_64-linux-gnu/libcuda.so.535.183.01
CUDA 安装
总结:
- 最简单方式是看 cuda 下载页面提供的安装命令
- deb 安装貌似无法只安装 cuda,不安装驱动
- runfile 安装可以做到不重启
- cuda-toolkit-12-1 包含 cuda
- nvidia-driver-530 包含驱动
有用链接
cuda 下载
cuda 和 driver 兼容性
运行 cuda 程序,需要
- 和 cuda 版本兼容的用户和内核驱动(每个 cuda 版本有个最低驱动版本)
- 如果是动态链接的,系统需要有 cuda 版本对应的库
1. Why CUDA Compatibility — CUDA Compatibility r555 documentation
10.x 之前,每次更新到一个小版本,都需要更新驱动。11.0 后有了小版本兼容性,因此老的驱动可以跑新的 cuda。cuda 11.0 要求最低 >= 450.80.02*
CUDA applications typically statically include all the libraries (for example cudart, CUDA math libraries such as cuBLAS, cuFFT) they need, so they should work on new drivers or CUDA Toolkit installations.
难怪 ldd cuda 程序看不到 cudart。
不同 metapackage
gpu driver
- nvidia-driver-550-server
- 和 headless 貌似冲突,只能安装其一
-open 版本包含开源的内核模块,而非 -open 版本是闭源的。
- -server 版本针对服务器和计算负载进行了优化,而非 -server 版本主要面向桌面和工作站使用。
其它的元包大部分除了 driver 都会安装其它库
- nvidia-headless-550 (server, open)
- This metapackage installs the NVIDIA driver and the libraries that enable parallel general purpose computation through CUDA and OpenCL.
- 不能运行图形程序:openGL, vulkan
- nvidia-dkms-550-server
- This package builds the NVIDIA kernel module needed by the userspace driver, using DKMS. Provided that you have the kernel header packages installed, the kernel module will be built for your running kernel, and automatically rebuilt for any new kernel headers that are installed.
- nvidia-headless-no-dkms-550
- This metapackage installs the NVIDIA driver and the libraries that enable parallel general purpose computation through CUDA and OpenCL. DKMS will not be installed, and, therefore, the kernel module will not be built. . Install this package if you do not need X11 or Wayland support, which is provided by the nvidia-driver-535 metapackage.
- 在内核更新后,DKMS 可以自动重新构建驱动模块,以确保与新内核兼容
cuda toolkit (nvcc etc)
cuda-toolkit-11-8
- Meta-package containing all the available toolkit packages related to native CUDA development. Contains the toolkit, samples, and documentation. Locked at CUDA Toolkit version 11.8. cuda-11-8
- Meta-package containing all the available packages required for native CUDA development. Contains the toolkit, samples, driver and documentation. Locked at CUDA Toolkit version 11.8.
3种方式
- 发行版源自带的
- 只包含 nvidia-driver,不包含 cuda toolkit
- rpm/deb packages
- 离线版 deb 文件
- 在线版 nvidia 源
- runfile package
- 和发行版无关 (distribution-independent package)
nvidia apt 源
包含所有版本 cuda,driver。其中 driver 可能比发行版源中的 driver 优先级更高
sudo add-apt-repository "deb https://developer.download.nvidia.com/compute/cuda/repos/ubuntu2004/x86_64/ /"
离线版 deb
使用方法
sudo dpkg -i cuda-repo-xxx.deb

sudo cp /var/cuda-repo-xxx/cuda-*-keyring.gpg /usr/share/keyrings/

sudo apt update
sudo apt install cuda-toolkit-xxx
查看离线方法安装的 cuda 版本
~ dpkg --list |grep cuda-repo
ii  cuda-repo-ubuntu2004-11-8-local                             11.8.0-520.61.05-1                                             amd64        cuda repository configuration files
ii  cuda-repo-ubuntu2004-12-1-local                             12.1.0-530.30.02-1                                             amd64        cuda repository configuration files
可以看到cuda-repo 包含一个 apt list 文件
内容为
fyyuan@snode6 ➜  ~ cat /etc/apt/sources.list.d/cuda-ubuntu2004-11-8-local.list
deb [signed-by=/usr/share/keyrings/cuda-368EAC11-keyring.gpg] file:///var/cuda-repo-ubuntu2004-11-8-local /
安装 deb 后,是添加了一个 repo。还需要再手动 install cuda。 不知为何安装 cuda 时一定会自动更新 driver,而使用 runfile 方式,则可以选择不安装驱动。
- 问题在于 cuda 是最大的一个 metapackage,安装 cuda-toolkit-xx 就好了
- cuda-toolkit-12-1
- nvidia-driver-530
fyyuan@snode6 ➜  archive sudo apt install cuda --no-install-recommends
Reading package lists... Done
Building dependency tree
Reading state information... Done

Recommended packages:
  libnvidia-compute-530:i386 libnvidia-decode-530:i386 libnvidia-encode-530:i386 libnvidia-fbc1-530:i386 libnvidia-gl-530:i386

The following packages will be REMOVED:
  cuda-drivers-495 libnvidia-cfg1-495 libnvidia-compute-495 libnvidia-decode-495 libnvidia-encode-495 libnvidia-extra-495 libnvidia-fbc1-495 libnvidia-gl-495 nvidia-compute-utils-495 nvidia-dkms-495 nvidia-driver-495 nvidia-kernel-common-495 nvidia-kernel-source-495
  nvidia-utils-495 xserver-xorg-video-nvidia-495

The following NEW packages will be installed:
  cuda-12-1 cuda-cccl-12-1 cuda-command-line-tools-12-1 cuda-compiler-12-1 cuda-cudart-12-1 cuda-cudart-dev-12-1 cuda-cuobjdump-12-1 cuda-cupti-12-1 cuda-cupti-dev-12-1 cuda-cuxxfilt-12-1 cuda-demo-suite-12-1 cuda-documentation-12-1 cuda-driver-dev-12-1 cuda-drivers-530
  cuda-gdb-12-1 cuda-libraries-12-1 cuda-libraries-dev-12-1 cuda-nsight-12-1 cuda-nsight-compute-12-1 cuda-nsight-systems-12-1 cuda-nvcc-12-1 cuda-nvdisasm-12-1 cuda-nvml-dev-12-1 cuda-nvprof-12-1 cuda-nvprune-12-1 cuda-nvrtc-12-1 cuda-nvrtc-dev-12-1 cuda-nvtx-12-1 cuda-nvvp-12-1
  cuda-opencl-12-1 cuda-opencl-dev-12-1 cuda-profiler-api-12-1 cuda-runtime-12-1 cuda-sanitizer-12-1 **cuda-toolkit-12-1** cuda-toolkit-12-1-config-common cuda-toolkit-12-config-common cuda-tools-12-1 cuda-visual-tools-12-1 gds-tools-12-1 libcublas-12-1 libcublas-dev-12-1
  libcufft-12-1 libcufft-dev-12-1 libcufile-12-1 libcufile-dev-12-1 libcurand-12-1 libcurand-dev-12-1 libcusolver-12-1 libcusolver-dev-12-1 libcusparse-12-1 libcusparse-dev-12-1 libnpp-12-1 libnpp-dev-12-1 libnvidia-cfg1-530 libnvidia-common-530 libnvidia-compute-530
  libnvidia-decode-530 libnvidia-encode-530 libnvidia-extra-530 libnvidia-fbc1-530 libnvidia-gl-530 libnvjitlink-12-1 libnvjitlink-dev-12-1 libnvjpeg-12-1 libnvjpeg-dev-12-1 libnvvm-samples-12-1 nsight-compute-2023.1.0 nsight-systems-2023.1.2 nvidia-compute-utils-530
  nvidia-dkms-530 **nvidia-driver-530** nvidia-kernel-common-530 nvidia-kernel-source-530 nvidia-utils-530 xserver-xorg-video-nvidia-530
The following packages will be upgraded:
  cuda cuda-drivers nvidia-modprobe nvidia-settings
4 upgraded, 76 newly installed, 15 to remove and 21 not upgraded.
Need to get 0 B/3,012 MB of archives.
After this operation, 7,064 MB of additional disk space will be used.
Do you want to continue? [Y/n]
runfile
不建议使用,否则会和 apt 方法冲突。且没有了 apt 的管理方式。
snode5 invalid device ordinal
(base) fyyuan@snode5 ➜  cuda-samples-11.0 git:(main) ✗ bin/x86_64/linux/release/bandwidthTest
[CUDA Bandwidth Test] - Starting...
Running on...

cudaGetDeviceProperties returned 101
-> invalid device ordinal
CUDA error at bandwidthTest.cu:256 code=101(cudaErrorInvalidDevice) "cudaSetDevice(currentDevice)"
(base) fyyuan@snode5 ➜  ~ sudo apt list --installed|grep nvidia

WARNING: apt does not have a stable CLI interface. Use with caution in scripts.

libnvidia-cfg1-470/now 470.182.03-0ubuntu0.20.04.1 amd64 [installed,upgradable to: 470.256.02-0ubuntu0.20.04.1]
libnvidia-common-470/now 470.182.03-0ubuntu0.20.04.1 all [installed,upgradable to: 470.256.02-0ubuntu0.20.04.1]
libnvidia-compute-470/now 470.182.03-0ubuntu0.20.04.1 amd64 [installed,upgradable to: 470.256.02-0ubuntu0.20.04.1]
libnvidia-container-tools/now 1.13.0-1 amd64 [installed,local]
libnvidia-container1/now 1.13.0-1 amd64 [installed,local]
libnvidia-decode-470/now 470.182.03-0ubuntu0.20.04.1 amd64 [installed,upgradable to: 470.256.02-0ubuntu0.20.04.1]
libnvidia-encode-470/now 470.182.03-0ubuntu0.20.04.1 amd64 [installed,upgradable to: 470.256.02-0ubuntu0.20.04.1]
libnvidia-extra-470/now 470.182.03-0ubuntu0.20.04.1 amd64 [installed,upgradable to: 470.256.02-0ubuntu0.20.04.1]
libnvidia-fbc1-470/now 470.182.03-0ubuntu0.20.04.1 amd64 [installed,upgradable to: 470.256.02-0ubuntu0.20.04.1]
libnvidia-gl-470/now 470.182.03-0ubuntu0.20.04.1 amd64 [installed,upgradable to: 470.256.02-0ubuntu0.20.04.1]
libnvidia-ifr1-470/now 470.182.03-0ubuntu0.20.04.1 amd64 [installed,upgradable to: 470.256.02-0ubuntu0.20.04.1]
libnvidia-ml-dev/focal,now 10.1.243-3 amd64 [installed]
nvidia-compute-utils-470/now 470.182.03-0ubuntu0.20.04.1 amd64 [installed,upgradable to: 470.256.02-0ubuntu0.20.04.1]
nvidia-container-runtime/now 3.13.0-1 all [installed,local]
nvidia-container-toolkit-base/now 1.13.0-1 amd64 [installed,local]
nvidia-container-toolkit/now 1.13.0-1 amd64 [installed,local]
nvidia-dkms-470/now 470.182.03-0ubuntu0.20.04.1 amd64 [installed,upgradable to: 470.256.02-0ubuntu0.20.04.1]
nvidia-driver-470/now 470.182.03-0ubuntu0.20.04.1 amd64 [installed,upgradable to: 470.256.02-0ubuntu0.20.04.1]
nvidia-kernel-common-470/now 470.182.03-0ubuntu0.20.04.1 amd64 [installed,upgradable to: 470.256.02-0ubuntu0.20.04.1]
nvidia-kernel-source-470/now 470.182.03-0ubuntu0.20.04.1 amd64 [installed,upgradable to: 470.256.02-0ubuntu0.20.04.1]
nvidia-utils-470/now 470.182.03-0ubuntu0.20.04.1 amd64 [installed,upgradable to: 470.256.02-0ubuntu0.20.04.1]
xserver-xorg-video-nvidia-470/now 470.182.03-0ubuntu0.20.04.1 amd64 [installed,upgradable to: 470.256.02-0ubuntu0.20.04.1]
安装不同发行版 deb
cuda 11.0 只有 20.04 deb,机器是 22.04。
keyring 报错
直接安装 deb 文件,会遇到 keyring 错误
W: GPG error: file:/var/cuda-repo-ubuntu2004-11-0-local  Release: The following signatures couldn't be verified because the public key is not available: NO_PUBKEY F60F4B3D7FA2AF80
E: The repository 'file:/var/cuda-repo-ubuntu2004-11-0-local  Release' is not signed.
N: Updating from such a repository can't be done securely, and is therefore disabled by default.
N: See apt-secure(8) manpage for repository creation and user configuration details.
解决配置 apt.source 禁用安全检查 man apt.secue
A repository which previously was authenticated but would loose this state in an update operation raises an error in all APT clients irrespective of the option to allow or forbid usage of insecure repositories. The error can be overcome by additionally setting Acquire::AllowDowngradeToInsecureRepositories to true or for Individual repositories with the sources.list(5) option allow-downgrade-to-insecure=yes.
vim /etc/apt/sources.list.d/cuda-ubuntu2004-11-0-local.list

deb [ allow-insecure=yes ] file:///var/cuda-repo-ubuntu2004-11-0-local /
如果还是不行(我遇到了),还是需要添加 key 使用 gpg 方式:
wget https://developer.download.nvidia.com/compute/cuda/repos/ubuntu2004/x86_64/7fa2af80.pub sudo gpg --dearmor -o /usr/share/keyrings/nvidia-cuda-keyring.gpg 7fa2af80.pub echo "deb [signed-by=/usr/share/keyrings/nvidia-cuda-keyring.gpg] https://developer.download.nvidia.com/compute/cuda/repos/ubuntu2004/x86_64/ /" | sudo tee /etc/apt/sources.list.d/cuda.list rm 7fa2af80.pub
gcc 版本不支持
衍生问题
/usr/local/cuda-11.0/bin/../targets/x86_64-linux/include/crt/host_config.h:139:2: error: #error -- unsupported GNU version! gcc versions later than 9 are not supported! The nvcc flag '-allow-unsupported-compiler' can be used to override this version check; however, using an unsupported host compiler may cause compilation failure or incorrect run time execution. Use at your own risk.
  139 | #error -- unsupported GNU version! gcc versions later than 9 are not supported! The nvcc flag '-allow-unsupported-compiler' can be used to override this version check; however, using an unsupported host compiler may cause compilation failure or incorrect run time execution. Use at your own risk.
解决,安装不同版本 gcc,并使用 update-alternative 切换
sudo apt install gcc-9 g++-9
sudo update-alternatives --install /usr/bin/gcc gcc /usr/bin/gcc-9 9
sudo update-alternatives --install /usr/bin/g++ g++ /usr/bin/g++-9 9
sudo update-alternatives --config gcc
sudo update-alternatives --config g++
gcc --version
安装后影响其它包?
正常 20.04 apt nvidia-container-toolkit
APT-Sources: https://developer.download.nvidia.com/compute/cuda/repos/ubuntu2004/x86_64  Packages
Description: NVIDIA Container toolkit
apt show nvidia-container-toolkit
Package: nvidia-container-toolkit
Version: 1.14.0~rc.2-1
Priority: optional
Section: utils
Maintainer: NVIDIA CORPORATION <cudatools@nvidia.com>
Installed-Size: 2,445 kB
Depends: nvidia-container-toolkit-base (= 1.14.0~rc.2-1), libnvidia-container-tools (>= 1.14.0~rc.2-1), libnvidia-container-tools (<< 2.0.0), libseccomp2
Breaks: nvidia-container-runtime (<= 3.5.0-1), nvidia-container-runtime-hook
Replaces: nvidia-container-runtime (<= 3.5.0-1), nvidia-container-runtime-hook
Homepage: https://github.com/NVIDIA/nvidia-container-toolkit
Download-Size: 859 kB
APT-Manual-Installed: yes
APT-Sources: https://nvidia.github.io/libnvidia-container/experimental/ubuntu18.04/amd64  Packages
Description: NVIDIA Container toolkit
 Provides tools and utilities to enable GPU support in containers.

N: There are 15 additional records. Please use the '-a' switch to see them.
不同版本冲突性
- 安装 cuda tookit,不同版本间没有冲突
- 安装 driver,不同版本使用同一种方式 (deb 或 runfile) 安装没有冲突
卸载
sudo /usr/local/cuda-X.Y/bin/cuda-uninstaller  # runfile


# cuda
sudo apt-get --purge remove "*cuda*" "*cublas*" "*cufft*" "*cufile*" "*curand*" "*cusolver*" "*cusparse*" "*gds-tools*" "*npp*" "*nvjpeg*" "nsight*" "*nvvm*"

sudo apt-get --purge remove "*cuda*" "*cublas*" "*cufft*" "*curand*" "*cusolver*" "*cusparse*" "*npp*" "*nvjpeg*" "nsight*" "*nvvm*"

# driver
sudo apt purge "*nvidia*" "libxnvctrl*"   # 只卸载nvidia-driver-xxx不够

sudo apt autoremove
环境变量选择版本
cuda_version="cuda-11.0"
export PATH="/usr/local/$cuda_version/bin:$PATH"
export LD_LIBRARY_PATH="/usr/local/$cuda_version/lib64:$LD_LIBRARY_PATH"
export demo_suite="/usr/local/$cuda_version/extras/demo_suite"

cd $demo_suite
./deviceQuery   # 获得设备信息
nvcc 使用
实例
卸载 runfile 后重启(没重启还有很多 nvdia 的模块)
root@icarus3:/home/nfs/fyyuan# lsmod |grep nv
nvidia_drm             65536  0
nvidia_modeset       1273856  1 nvidia_drm
nvidia              55701504  27 gdrdrv,nvidia_modeset
drm_kms_helper        184320  4 ast,nvidia_drm
drm                   495616  7 drm_kms_helper,drm_vram_helper,ast,nvidia,nvidia_drm,ttm
安装 driver
root@icarus3:/home/nfs/fyyuan# apt-cache policy nvidia-driver-530
nvidia-driver-530:
  Installed: 530.41.03-0ubuntu0.20.04.2
  Candidate: 530.41.03-0ubuntu0.20.04.2
  Version table:
 *** 530.41.03-0ubuntu0.20.04.2 500
        500 https://mirrors.ustc.edu.cn/ubuntu focal-updates/restricted amd64 Packages
        500 https://mirrors.ustc.edu.cn/ubuntu focal-security/restricted amd64 Packages
        100 /var/lib/dpkg/status
安装 cuda
apt install nvidia-cuda-toolkit

root@icarus3:/home/nfs/fyyuan# nvcc -V
nvcc: NVIDIA (R) Cuda compiler driver
Copyright (c) 2005-2019 NVIDIA Corporation
Built on Sun_Jul_28_19:07:16_PDT_2019
Cuda compilation tools, release 10.1, V10.1.243
版本太老,为 10.1 的
i0 上有许多 apt source
- cuda-ubuntu2004-12-1-local.list 对应/var/cuda-repo-ubuntu2004-12-1-local/,包含很多 deb 文件
- cuda-ubuntu2004-x86_64.list 为 https://developer.download.nvidia.com/compute/cuda
deb [signed-by=/usr/share/keyrings/cuda-archive-keyring.gpg] https://developer.download.nvidia.com/compute/cuda /repos/ubuntu2004/x86_64/ / - source.list 中还直接包含
deb https://developer.download.nvidia.com/compute/cuda/repos/ubuntu2004/x86_64/ /
root@icarus0:/usr/local/cuda-12.1/bin# ls /etc/apt/sources.list.d/
cuda-ubuntu2004-12-1-local.list       docker.list       nvidia-container-toolkit.list.save
cuda-ubuntu2004-12-1-local.list.save  docker.list.save  nvidia-docker.list.save
cuda-ubuntu2004-x86_64.list           mlnx.list
cuda-ubuntu2004-x86_64.list.save      mlnx.list.save
官网按照 deb(network),发现添加了源,设置了
root@icarus3:/home/nfs/fyyuan# apt install cuda
Reading package lists... Done
Building dependency tree
Reading state information... Done
The following additional packages will be installed:
  cuda-12-1 cuda-cccl-12-1 cuda-command-line-tools-12-1 cuda-compiler-12-1 cuda-cudart-12-1 cuda-cudart-dev-12-1 cuda-cuobjdump-12-1 cuda-cupti-12-1
  cuda-cupti-dev-12-1 cuda-cuxxfilt-12-1 cuda-demo-suite-12-1 cuda-documentation-12-1 cuda-driver-dev-12-1 cuda-drivers cuda-drivers-530 cuda-gdb-12-1
  cuda-libraries-12-1 cuda-libraries-dev-12-1 cuda-nsight-12-1 cuda-nsight-compute-12-1 cuda-nsight-systems-12-1 cuda-nvcc-12-1 cuda-nvdisasm-12-1
  cuda-nvml-dev-12-1 cuda-nvprof-12-1 cuda-nvprune-12-1 cuda-nvrtc-12-1 cuda-nvrtc-dev-12-1 cuda-nvtx-12-1 cuda-nvvp-12-1 cuda-opencl-12-1
  cuda-opencl-dev-12-1 cuda-profiler-api-12-1 cuda-runtime-12-1 cuda-sanitizer-12-1 cuda-toolkit-12-1 cuda-toolkit-12-1-config-common
  cuda-toolkit-12-config-common cuda-toolkit-config-common cuda-tools-12-1 cuda-visual-tools-12-1 default-jre default-jre-headless gds-tools-12-1
  libcublas-12-1 libcublas-dev-12-1 libcufft-12-1 libcufft-dev-12-1 libcufile-12-1 libcufile-dev-12-1 libcurand-12-1 libcurand-dev-12-1 libcusolver-12-1
  libcusolver-dev-12-1 libcusparse-12-1 libcusparse-dev-12-1 libnpp-12-1 libnpp-dev-12-1 libnvjitlink-12-1 libnvjitlink-dev-12-1 libnvjpeg-12-1
  libnvjpeg-dev-12-1 libnvvm-samples-12-1 nsight-compute-2023.1.1 nsight-systems-2023.1.2 nvidia-modprobe nvidia-settings openjdk-11-jre
  openjdk-11-jre-headless
Suggested packages:
  fonts-ipafont-gothic fonts-ipafont-mincho fonts-wqy-microhei | fonts-wqy-zenhei fonts-indic
The following NEW packages will be installed:
  cuda cuda-12-1 cuda-cccl-12-1 cuda-command-line-tools-12-1 cuda-compiler-12-1 cuda-cudart-12-1 cuda-cudart-dev-12-1 cuda-cuobjdump-12-1 cuda-cupti-12-1
  cuda-cupti-dev-12-1 cuda-cuxxfilt-12-1 cuda-demo-suite-12-1 cuda-documentation-12-1 cuda-driver-dev-12-1 cuda-drivers cuda-drivers-530 cuda-gdb-12-1
  cuda-libraries-12-1 cuda-libraries-dev-12-1 cuda-nsight-12-1 cuda-nsight-compute-12-1 cuda-nsight-systems-12-1 cuda-nvcc-12-1 cuda-nvdisasm-12-1
  cuda-nvml-dev-12-1 cuda-nvprof-12-1 cuda-nvprune-12-1 cuda-nvrtc-12-1 cuda-nvrtc-dev-12-1 cuda-nvtx-12-1 cuda-nvvp-12-1 cuda-opencl-12-1
  cuda-opencl-dev-12-1 cuda-profiler-api-12-1 cuda-runtime-12-1 cuda-sanitizer-12-1 cuda-toolkit-12-1 cuda-toolkit-12-1-config-common
  cuda-toolkit-12-config-common cuda-toolkit-config-common cuda-tools-12-1 cuda-visual-tools-12-1 default-jre default-jre-headless gds-tools-12-1
  libcublas-12-1 libcublas-dev-12-1 libcufft-12-1 libcufft-dev-12-1 libcufile-12-1 libcufile-dev-12-1 libcurand-12-1 libcurand-dev-12-1 libcusolver-12-1
  libcusolver-dev-12-1 libcusparse-12-1 libcusparse-dev-12-1 libnpp-12-1 libnpp-dev-12-1 libnvjitlink-12-1 libnvjitlink-dev-12-1 libnvjpeg-12-1
  libnvjpeg-dev-12-1 libnvvm-samples-12-1 nsight-compute-2023.1.1 nsight-systems-2023.1.2 nvidia-modprobe openjdk-11-jre openjdk-11-jre-headless
The following packages will be upgraded:
  nvidia-settings
1 upgraded, 69 newly installed, 0 to remove and 59 not upgraded.
Need to get 2802 MB of archives.
After this operation, 6511 MB of additional disk space will be used.
Do you want to continue? [Y/n]
NVCC
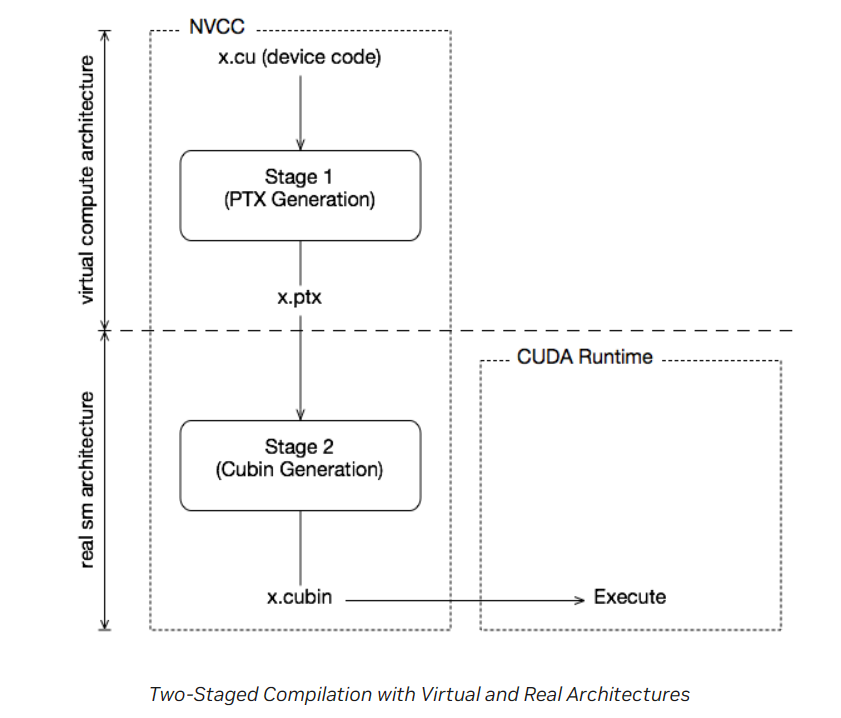
两阶段编译
GPU 不同 generation,二进制程序是不兼容的。为了保证应用的兼容性,采用了两阶段编译。
- nvcc 总是需要使用两个架构:虚拟架构 (compute_xx) 和真实架构 (sm_xx)
- sm 必须实现了 compute 的功能
- 虚拟架构表明了应用使用到的能力,使用更低的虚拟架构允许在更广泛的硬件上运行
- 真实架构越高,生成的代码就更高效(硬件特性更多)
JIT 机制
- 将 cubin 生成推迟到运行时
- 缺点是增加了应用 startup 延迟
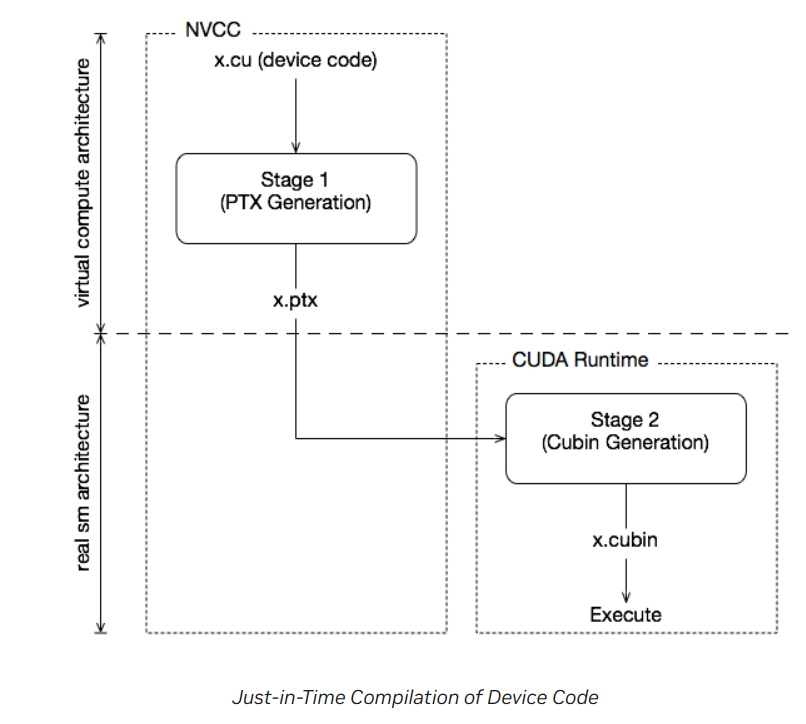
By specifying a virtual code architecture instead of a real GPU, nvcc postpones the assembly of PTX code until application runtime, at which time the target GPU is exactly known.
fatbinaries
A different solution to overcome startup delay by JIT while still allowing execution on newer GPUs is to specify multiple code instances
example
--gpu-architecture或-arch
JIT
gpu-code 如果也指定虚拟架构,表明使用 JIT
--gpu-code arguments can be virtual architectures. In this case the stage 2 translation will be omitted for such virtual architecture, and the stage 1 PTX result will be embedded instead. At application launch, and in case the driver does not find a better alternative, the stage 2 compilation will be invoked by the driver with the PTX as input.
省略 gpu-code
分别等价于
nvcc x.cu --gpu-architecture=compute_52 --gpu-code=sm_52,compute_52
nvcc x.cu --gpu-architecture=compute_50 --gpu-code=compute_50
同时省略 arch, gpu-code
默认使用 sm_52?
-generate-code 指定多种组合
使用一个虚拟架构,限制了功能。可以为不同硬件指定不同虚拟架构
compute_50assumes no half-precision floating-point operation support for both thesm_50code and thesm_53code:
nvcc x.cu \
    --generate-code arch=compute_50,code=sm_50 \
    --generate-code arch=compute_50,code=sm_52 \
    --generate-code arch=compute_53,code=sm_53
查看编译结果包含哪些版本
nvcc 选项
On all platforms, the default host compiler executable (gcc and g++ on Linux and cl.exe on Windows) found in the current execution search path will be used, unless specified otherwise with appropriate options
When -arch=native is specified, nvcc detects the visible GPUs on the system and generates codes for them, no PTX program will be generated for this option. It is a warning if there are no visible supported GPU on the system, and the default architecture will be used.
If -arch=all is specified, nvcc embeds a compiled code image for all supported architectures (sm_*), and a PTX program for the highest major virtual architecture. For -arch=all-major, nvcc embeds a compiled code image for all supported major versions (sm_*0), plus the earliest supported, and adds a PTX program for the highest major virtual architecture.
环境变量
https://docs.nvidia.com/cuda/cuda-compiler-driver-nvcc/index.html#nvcc-environment-variables
Cuda 编程
多 device 系统
很多操作都可以并发执行,如 host 和 device、memory 复制和 kernel launch 等
steram 是用来管理并发执行的
A host thread can set the device it operates on at any time by calling cudaSetDevice(). Device memory allocations and kernel launches are made on the currently set device; streams and events are created in association with the currently set device. If no call to cudaSetDevice() is made, the current device is device 0.
为什么 __device__ 函数不需要 <<<...>>>
__device__函数本质上是 GPU 上的一个子程序或函数库,它不能独立启动。- 它的执行完全依赖于调用它的函数,没有自己的执行配置。
- 当
__global__函数被启动时,CUDA 运行时环境会负责为它分配线程资源,并管理它的执行。 - 如果
__global__函数调用了__device__函数,那么__device__函数会在__global__函数的线程上下文中执行,无需额外的配置。
统一内存模型
在 CUDA 编程中,__managed__ 是一个 CUDA 扩展关键字,用于标识被修饰的变量或数据结构将在主机(CPU)和设备(GPU)之间自动进行内存管理。它是 CUDA Unified Memory 功能的一部分,旨在简化主机和设备之间的内存管理和数据传输。
通过使用 __managed__ 关键字,您可以将变量或数据结构声明为统一内存(Unified Memory)。这意味着在使用这些统一内存对象时,无需显式地在主机和设备之间进行手动内存分配和数据传输。CUDA 运行时系统会自动处理内存的分配和迁移,以确保数据在主机和设备之间正确共享。
同步
cuda - Does __syncthreads() synchronize all threads in the grid? - Stack Overflow
- cudaDeviceSynchronize
- CPU 等待 GPU 完成 kernel 调用
CUDA 没有全局同步(block 间同步)
- 对于 SM 数量很大的 GPU,硬件成本太高
- would force programmer to run fewer blocks (no more than # multiprocessors * # resident blocks / multiprocessor) to avoid deadlock, which may reduce overall efficiency 解决办法: 分解为多个 kernel
- kernel launch 作为 global sync point
- kernel launch has negligible HW overhead, low SW overhead
cuBLAS
计算矩阵 A x B 方式一:
cublasSgemm (blas_handle, CUBLAS_OP_T, CUBLAS_OP_T,   //CUBLAS使用列优先存储。CUBLAS_OP_T表示进行转置,即行优先。列优先下leading dimesion为m(mxn矩阵)
                     m, n, k,
                     &alpha,
                     d_A, k, d_B, n,
                     &beta,
                     d_C, n); //结果仍为列优先,故计算得到C的转置
方式二:
/* 通过计算B^T * A^T得到C^T,由于列优先所有d_C实际为C的行优先结果。 //https://stackoverflow.com/a/56064726
        疑问:这里beta等于0,故C的初始值没有影响,行列优先均可(ldc=m, n均正确)。但是如果非0,那么如何处理呢?
        */
        cublasSgemm(blas_handle, CUBLAS_OP_N, CUBLAS_OP_N,
                    n, m, k,
                    &alpha,
                    d_B, n, d_A, k,
                    &beta,
                    d_C, n);
工具
- IDE/debug/profile工具预览:NVIDIA Developer Tools Overview | NVIDIA Developer
Which tools are available on which GPU architectures
Which tools are available on which GPU architectures
| GPU architecture | Visual Profiler and nvprof | Nsight Systems | Nsight Compute |
|---|---|---|---|
| Maxwell | Yes | No | No |
| Pascal | Yes | Yes | No |
| Volta | Yes | Yes | Yes |
| Turing | Yes* | Yes | Yes |
| Ampere and later GPU architectures | No | Yes | Yes |
nsight sytem
- high level
nsight compute
- detailed
- performance metrics
nvprof
The Visual Profiler is a graphical profiling tool that displays a timeline of your application’s CPU and GPU activity, and that includes an automated analysis engine to identify optimization opportunities. The nvprof profiling tool enables you to collect and view profiling data from the command-line.
Note that Visual Profiler and nvprof will be deprecated in a future CUDA release. The NVIDIA Volta platform is the last architecture on which these tools are fully supported. It is recommended to use next-generation tools NVIDIA Nsight Systems for GPU and CPU sampling and tracing and NVIDIA Nsight Compute for GPU kernel profiling.
Visual Profiler/nvvp
NVIDIA Visual Profiler | NVIDIA Developer
https://docs.nvidia.com/cuda/profiler-users-guide/index.html#visual-profiler
The Visual Profiler is available as both a standalone application and as part of Nsight Eclipse Edition. The standalone version of the Visual Profiler, nvvp, is included in the CUDA Toolkit for all supported OSes except for macOS.
步骤
- 安装设置 1.8 JRE
- Preparing An Application For Profiling
- create session: A session contains the settings, data, and profiling results associated with your application. Each session is saved in a separate file; so you can delete, move, copy, or share a session by simply deleting, moving, copying, or sharing the session file. By convention, the file extension
.nvvpis used for Visual Profiler session files. - analyziing
java 版本
需要 Java Runtime Environment (JRE) 1.8 可以启动时通过 vm 指定
也可以设置全局 java 版本
update-alternatives 是一个 Debian 系统中用于管理多个软件版本的工具。通过它,你可以轻松切换默认使用的 Java 版本
IOException: locking file
(base) fyyuan@snode6 ➜  ~ nvvp -vm /usr/lib/jvm/java-8-openjdk-amd64/jre/bin/java
java.lang.RuntimeException: Error initializing storage.
        at org.eclipse.osgi.internal.framework.EquinoxContainer.<init>(EquinoxContainer.java:77)
        at org.eclipse.osgi.launch.Equinox.<init>(Equinox.java:31)
        at org.eclipse.core.runtime.adaptor.EclipseStarter.startup(EclipseStarter.java:295)
        at org.eclipse.core.runtime.adaptor.EclipseStarter.run(EclipseStarter.java:231)
        at sun.reflect.NativeMethodAccessorImpl.invoke0(Native Method)
        at sun.reflect.NativeMethodAccessorImpl.invoke(NativeMethodAccessorImpl.java:62)
        at sun.reflect.DelegatingMethodAccessorImpl.invoke(DelegatingMethodAccessorImpl.java:43)
        at java.lang.reflect.Method.invoke(Method.java:498)
        at org.eclipse.equinox.launcher.Main.invokeFramework(Main.java:648)
        at org.eclipse.equinox.launcher.Main.basicRun(Main.java:603)
        at org.eclipse.equinox.launcher.Main.run(Main.java:1465)
        at org.eclipse.equinox.launcher.Main.main(Main.java:1438)
Caused by: java.io.IOException: An error occurred while locking file "/staff/fyyuan/.eclipse/org.eclipse.platform_4.4.1_868875438_linux_gtk_x86_64/configuration/org.eclipse.osgi/.manager/.fileTableLock": "Input/output error". A common reason is that the file system or Runtime Environment does not support file locking for that location. Please choose a different location, or disable file locking by passing "-Dosgi.locking=none" as a VM argument.
        at org.eclipse.osgi.internal.location.Locker_JavaNio.lock(Locker_JavaNio.java:49)
        at org.eclipse.osgi.storagemanager.StorageManager.lock(StorageManager.java:388)
        at org.eclipse.osgi.storagemanager.StorageManager.open(StorageManager.java:701)
        at org.eclipse.osgi.storage.Storage.getChildStorageManager(Storage.java:1747)
        at org.eclipse.osgi.storage.Storage.getInfoInputStream(Storage.java:1764)
        at org.eclipse.osgi.storage.Storage.<init>(Storage.java:124)
        at org.eclipse.osgi.storage.Storage.createStorage(Storage.java:84)
        at org.eclipse.osgi.internal.framework.EquinoxContainer.<init>(EquinoxContainer.java:75)
        ... 11 more
提示的添加 vm 参数方法,添加到 cuda-tookit-dir/libnvvp/nvvp.ini 结尾(使用-vmargs 指定)
sudo vim /usr/local/cuda-11.8/libnvvp/nvvp.ini

-startup
plugins/org.eclipse.equinox.launcher_1.3.0.v20140415-2008.jar
--launcher.library
plugins/org.eclipse.equinox.launcher.gtk.linux.x86_64_1.1.200.v20140603-1326
-data
@noDefault
-vmargs
-Dosgi.locking=none
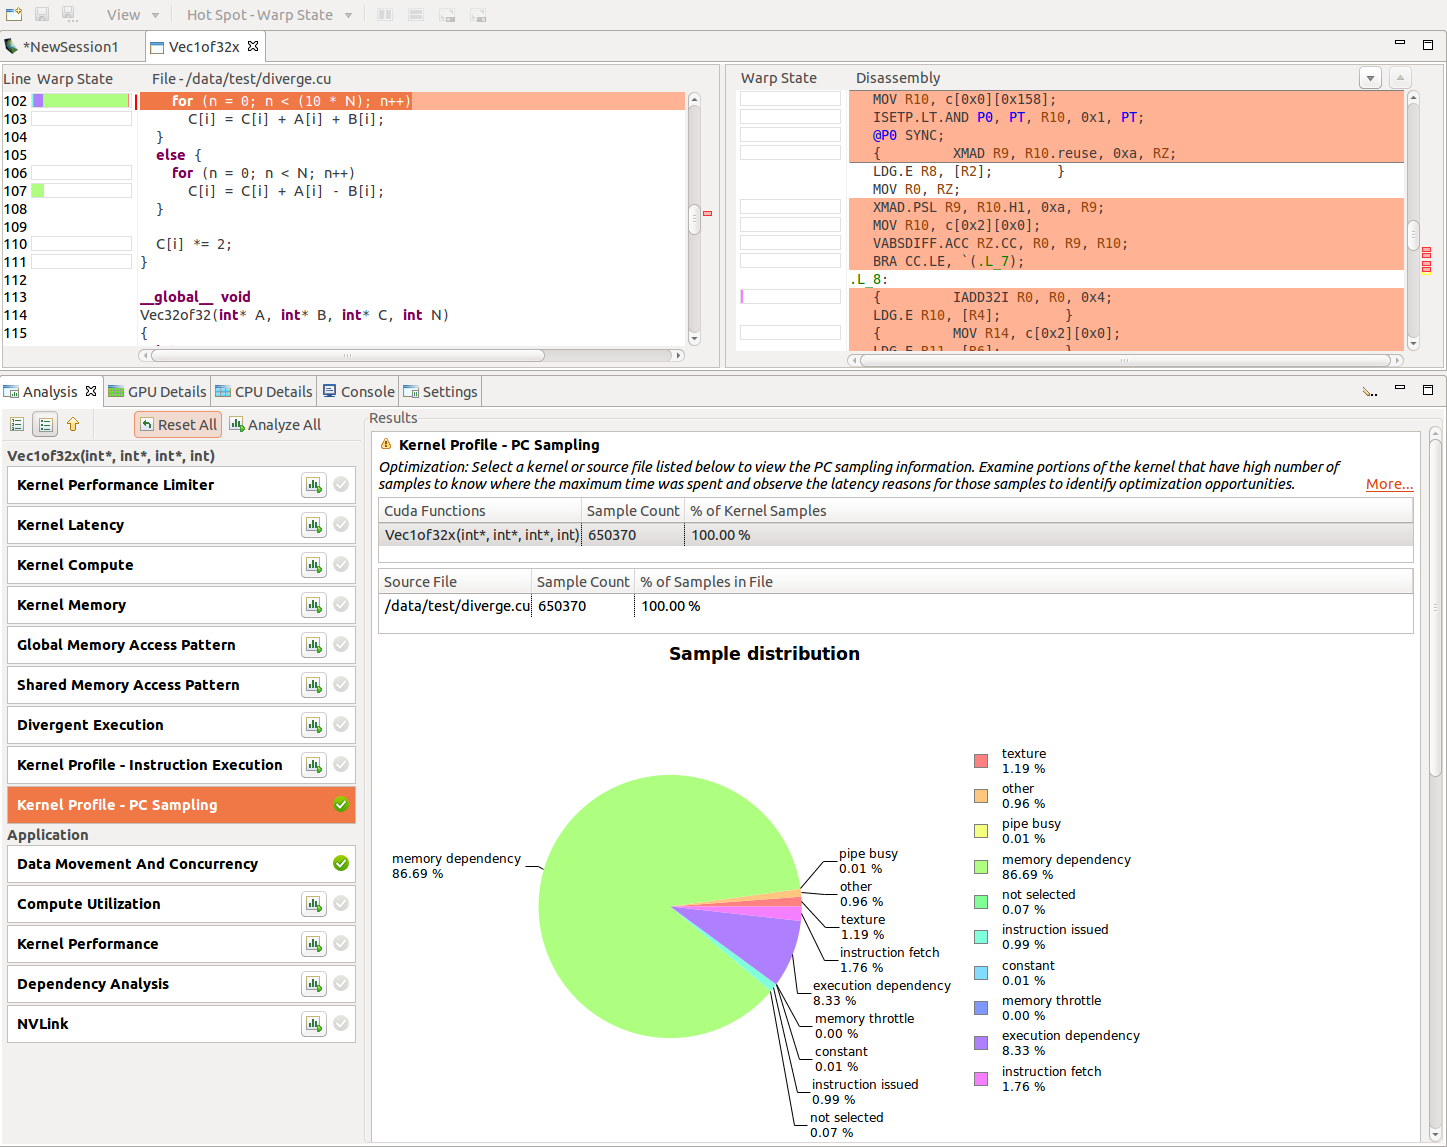
PC sample View
- compute_52 支持 PC 采样。
- PC and state of warp are sampled at regular interval for one of the active warps per SM
- The warp state indicates if that warp issued an instruction in a cycle or why it was stalled and could not issue an instruction
- Hence the stall for the sampled warp need not necessarily indicate that there is a hole in the instruction issue pipeline.
- compute_60 支持 latency reasons
- While collecting these samples, there is no instruction issued in the respective warp scheduler and hence these give the latency reasons.
6.0 以上设备,Visual Profiler show two views: ‘Kernel Profile - PC Sampling’which gives the warp state view and‘Kernel Profile - PC Sampling - Latency’which gives the latency reasons.
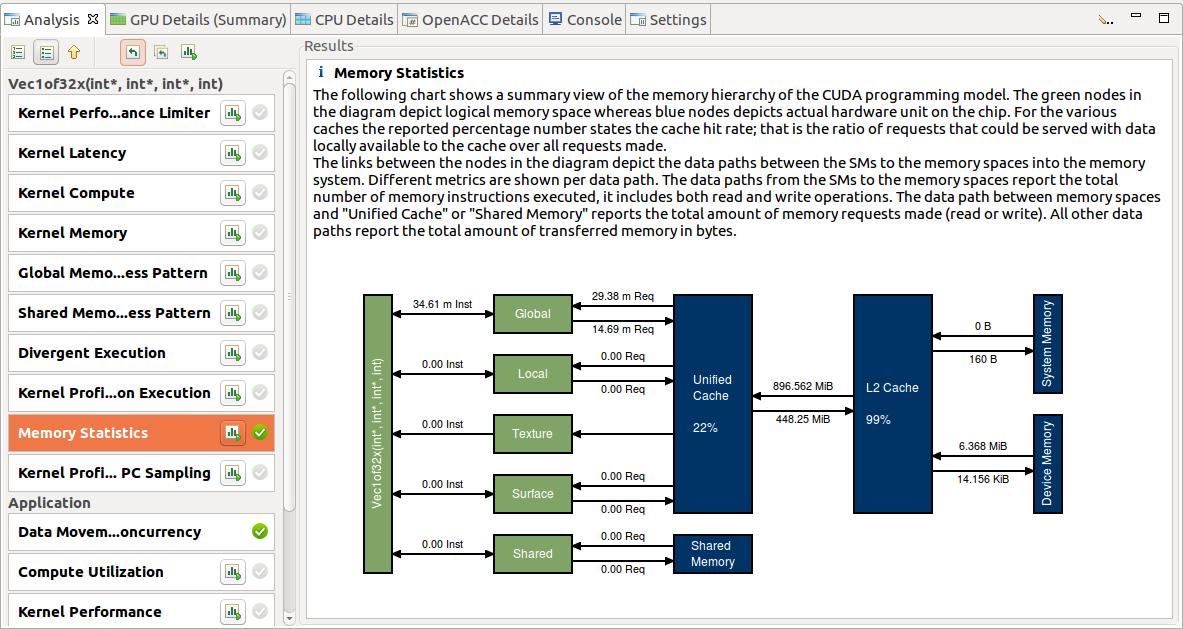
memory 统计
- The data paths from the SMs to the memory spaces (Global, Local, Texture, Surface and Shared) report the total number of memory instructions executed, it includes both read and write operations.
- The data path between memory spaces and “Unified Cache” or “Shared Memory” reports the total amount of memory requests made.
- All other data paths report the total amount of transferred memory in bytes.
source-disassembly
-lineinfo
Warp state/stall原因
1. Preparing An Application For Profiling — Profiler 12.3 documentation (nvidia.com)
https://docs.nvidia.com/cuda/profiler-users-guide/index.html#warp-state
能够对应到源码进行分析:CUDA 7.5: Pinpoint Performance Problems with Instruction-Level Profiling | NVIDIA Technical Blog
- Instruction issued
- Stalled
- Stalled for instruction fetch
- For very short kernels, consider fusing into a single kernels.
- Stalled for execution dependency
- Stalled for memory dependency
- 尝试提高内存合并和/或获取字节的效率(对齐等)。使用 gld_efficiency 和 gst_efficiency 检查未合并的内存访问
- memory-level parallelism (MLP): the number of independent memory operations in flight per thread. Loop unrolling, loading vector types such as float4, and processing multiple elements per thread are all ways to increase memory-level parallelism.
- 请考虑将经常访问的数据移动到更靠近 SM 的位置,例如使用共享内存或只读数据缓存。
- 考虑尽可能重新计算数据,而不是从设备内存加载数据
- 如果本地内存访问量很高,请考虑增加每个线程的寄存器计数以减少溢出,即使以占用率为代价
- Stalled for memory throttle
- Stalled for texture
- Stalled for sync
- Stalled for constant memory dependency
- Stalled for pipe busy:functional unit busy
- Stalled for not selected:Warp 已准备就绪,但没有机会发出,因为选择了其他一些 Warp 进行发出。
- Stalled for other:Warp 因不常见的原因(如编译器或硬件原因)而被阻止。开发人员无法控制这些 stall。
- Stalled for instruction fetch
nvprof
- Summary Mode
- 默认模式,
nvprofoutputs a single result line for each kernel function and each type of CUDA memory copy/set performed by the application. - 如果不需要,可以使用 关闭 API 跟踪
--profile-api-trace none。这减少了一些性能分析开销,尤其是在内核较短时。
- 默认模式,
- gpu-trace
- GPU-Trace mode provides a timeline of all activities taking place on the GPU in chronological order.
- 按照时间顺序显示。同一个 kernel 会多次显示
nvprof --print-gpu-trace matrixMul
- API-trace: API-trace mode shows the timeline of all CUDA runtime and driver API calls invoked on the host in chronological order.
- 显示 runtime 和 driver API 调用
nvprof --print-api-trace matrixMul
- Event/metric Summary Mode
--events all--metrics all
An event is a countable activity, action, or occurrence on a device. It corresponds to a single hardware counter value which is collected during kernel execution. To see a list of all available events on a particular NVIDIA GPU, type nvprof --query-events.
A metric is a characteristic of an application that is calculated from one or more event values. To see a list of all available metrics on a particular NVIDIA GPU, type nvprof --query-metrics. You can also refer to the metrics reference .
选项:(https://docs.nvidia.com/cuda/profiler-users-guide/#command-line-options)
Usage: nvprof [options] [application] [application-arguments]
--analysis-metrics
                        Collect profiling data that can be imported to Visual Profiler's
                        "analysis" mode. Note: Use "--export-profile" to specify
                        an export file.

--devices <device ids>
                        Change the scope of subsequent "--events", "--metrics", "--query-events"
                        and "--query-metrics" options.
                        Allowed values:
                                all - change scope to all valid devices
                                comma-separated device IDs - change scope to specified
                        devices

  -e,  --events <event names>
                        Specify the events to be profiled on certain device(s). Multiple
                        event names separated by comma can be specified. Which device(s)
                        are profiled is controlled by the "--devices" option. Otherwise
                        events will be collected on all devices.
                        For a list of available events, use "--query-events".
                        Use "--events all" to profile all events available for each
                        device.
                        Use "--devices" and "--kernels" to select a specific kernel
                        invocation.
 --kernels <kernel path syntax>
                        Change the scope of subsequent "--events", "--metrics" options.
                        The syntax is as follows:
                                <kernel name>
                                Limit scope to given kernel name.
                        or
                                <context id/name>:<stream id/name>:<kernel name>:<invocation>
                        The context/stream IDs, names, kernel name and invocation
                        can be regular expressions. Empty string matches any number
                        or characters. If <context id/name> or <stream id/name>
                        is a positive number, it's strictly matched against the
                        CUDA context/stream ID. Otherwise it's treated as a regular
                        expression and matched against the context/stream name specified
                        by the NVTX library. If the invocation count is a positive
                        number, it's strictly matched against the invocation of
                        the kernel. Otherwise it's treated as a regular expression.
                        Example: --kernels "1:foo:bar:2" will profile any kernel
                        whose name contains "bar" and is the 2nd instance on context
                        1 and on stream named "foo".

  -m,  --metrics <metric names>
                        Specify the metrics to be profiled on certain device(s).
                        Multiple metric names separated by comma can be specified.
                        Which device(s) are profiled is controlled by the "--devices"
                        option. Otherwise metrics will be collected on all devices.
                        For a list of available metrics, use "--query-metrics".
                        Use "--metrics all" to profile all metrics available for
                        each device.
                        Use "--devices" and "--kernels" to select a specific kernel
                        invocation.
                        Note: "--metrics all" does not include some metrics which
                        are needed for Visual Profiler's source level analysis.
                        For that, use "--analysis-metrics".

 --pc-sampling-period <period>
                        Specify PC Sampling period in cycles,  at which the sampling
                        records will be dumped. Allowed values for the period are
                        integers between 5 to 31 both inclusive.
                        This will set the sampling period to (2^period) cycles
                        Default value is a number between 5 and 12 based on the setup.
                        Note: Only available for GM20X+.

 --print-api-summary
                  Print a summary of CUDA runtime/driver API calls.

 --print-api-trace
                  Print CUDA runtime/driver API trace.

 --print-gpu-trace
                        Print individual kernel invocations (including CUDA memcpy's/memset's)
                        and sort them in chronological order. In event/metric profiling
                        mode, show events/metrics for each kernel invocation.
  -s,  --print-summary
                        Print a summary of the profiling result on screen. Note:
                        This is the default unless "--export-profile" or other print
                        options are used.

  -o,  --export-profile <filename>
                        Export the result file which can be imported later or opened
                        by the NVIDIA Visual Profiler.
                                "%p" in the file name string is replaced with the
                        process ID of the application being profiled.
                                "%q{<ENV>}" in the file name string is replaced
                        with the value of the environment variable "<ENV>". If the
                        environment variable is not set it's an error.
                                "%h" in the file name string is replaced with the
                        hostname of the system.
                                "%%" in the file name string is replaced with "%".
                                Any other character following "%" is illegal.
                        By default, this option disables the summary output. Note:
                        If the application being profiled creates child processes,
                        or if '--profile-all-processes' is used, the "%p" format
                        is needed to get correct export files for each process.
metric 具体含义:1. Preparing An Application For Profiling — Profiler 12.3 documentation (nvidia.com)
The Visual Profiler is a graphical profiling tool that displays a timeline of your application’s CPU and GPU activity, and that includes an automated analysis engine to identify optimization opportunities. The nvprof profiling tool enables you to collect and view profiling data from the command-line.
下一代
Note that Visual Profiler and nvprof will be deprecated in a future CUDA release. The NVIDIA Volta platform is the last architecture on which these tools are fully supported. It is recommended to use next-generation tools NVIDIA Nsight Systems for GPU and CPU sampling and tracing and NVIDIA Nsight Compute for GPU kernel profiling.
迁移:1. Preparing An Application For Profiling — Profiler 12.3 documentation (nvidia.com)
- An event is a countable activity, action, or occurrence on a device. It corresponds to a single hardware counter value which is collected during kernel execution. To see a list of all available events on a particular NVIDIA GPU, type
nvprof --query-events. - A metric is a characteristic of an application that is calculated from one or more event values. To see a list of all available metrics on a particular NVIDIA GPU, type
nvprof --query-metrics. You can also refer to the metrics reference .
支持 cudaProfilerStart, Stop CUDA API 用于专注部分代码的分析。nvprof 需要使用--profile-from-start off 来使用
NVTX 用于给 CPU 代码打上标记,好在工具里看到
To understand what the application’s CPU threads are doing outside of CUDA function calls, you can use the NVIDIA Tools Extension API (NVTX). When you add NVTX markers and ranges to your application, the Timeline View shows when your CPU threads are executing within those regions.
The Visual Profiler is available as both a standalone application and as part of Nsight Eclipse Edition. The standalone version of the Visual Profiler, nvvp, is included in the CUDA Toolkit for all supported OSes
流程
- 准备应用程序
- 二进制程序,不用专门修改。但是使用 NVTX 更好
Nsight Compute
Nsight Compute Documentation (nvidia.com)
- Kernel Profiling Guide
- Kernel Profiling Guide with metric types and meaning, data collection modes and FAQ for common problems.
- Nsight Compute
- NVIDIA Nsight Compute User Interface (UI) manual. Information on all views, controls and workflows within the tool UI. Transitions guide for Visual Profiler.
- Nsight Compute CLI
- NVIDIA Nsight Compute Command Line Interface (CLI) manual. Information on workflows and options for the command line, including multi-process profiling and NVTX filtering. Transitions guide for Nvprof.
- nvprof:sm7.5 之前使用,被 nsight compute 替代
- Nsight compute
- 图形化界面
- 命令行:ncu
ncu
Nsight Compute CLI :: Nsight Compute Documentation (nvidia.com)
metric
--metric
Specify all metrics to be profiled, separated by comma. If no --section options are given, only the temporary section containing all metrics listed using this option is collected. If --section options are given in addition to --metrics, all metrics from those sections and from --metrics are collected.
nvprof metric 在 ncu 中的表示 Nsight Compute CLI :: Nsight Compute Documentation (nvidia.com)
问题
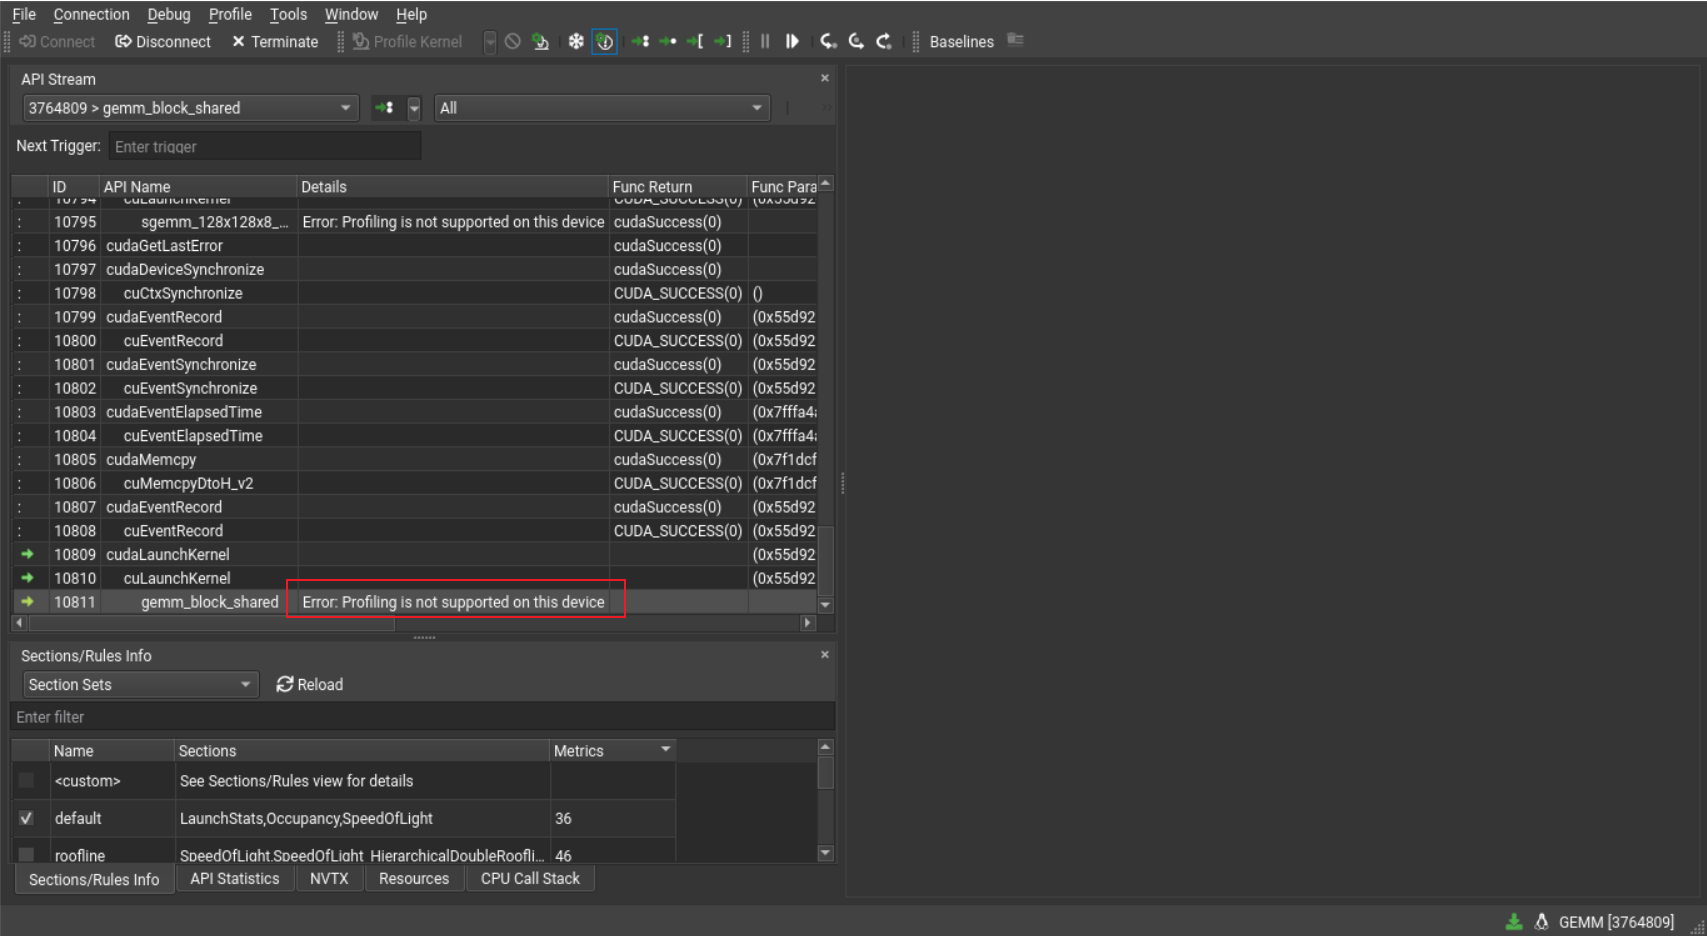
Profiling is not supported on this device
Nsight compute 支持的 GPU:Release Notes :: Nsight Compute Documentation (nvidia.com)
- 不支持 pascal(如 gtx1080),从 Volta GV100 开始支持
无权限使用 metric
修改/etc/modprobe.d,重启保持修改
sudo vim /etc/modprobe.d/nvidia_profile.conf

options nvidia NVreg_RestrictProfilingToAdminUsers=0

update-initramfs -u -k all #更新initramfs, -k all指定所有内核版本
不用重启,临时修改方法
modprobe -rf nvidia_uvm nvidia_drm nvidia_modeset nvidia-vgpu-vfio nvidia

modprobe nvidia NVreg_RestrictProfilingToAdminUsers=0
无法移除时,查看是什么进程占用了 gpu
可能需要停止 nvidia-persistenced.service 服务
调试工具
cuda-memck
使用 cuda-memcheck 检查程序是否有非法地址访问。会使得程序执行变慢
cuda-gdb 调试
cuda-gdb 和 gdb 使用类似。
cuda 程序如果代码写错,执行时只能从内核日志中看到报错信息(如 Xid 报错),非常不便。
而使用 cuda-gdb 可以直接定位哪出代码访存错误:
(cuda-gdb) r 10 10 10                                                                                CUDA Exception: Warp Illegal Address                                                                 The exception was triggered at PC 0x55555617ff10 (GEMM.cu:82)

Thread 1 "GEMM" received signal CUDA_EXCEPTION_14, Warp Illegal Address.
[Switching focus to CUDA kernel 0, grid 4, block (0,0,0), thread (0,6,0), device 0, sm 0, warp 6, lane 0] 0x000055555617ff20 in gemm_block_shared<32, 32, 8><<<(32,32,1),(32,32,1)>>> (A=0x7fffbda00000, B=0x7fffd7800000, C=0x7fffd7c00000, m=1024, k=1024, n=1024) at GEMM.cu:82
82                  Bs[ty][tx] = B(iter * bm + ty, bx * bk + tx); //(tx, ty) in block B(iter, bx)
(cuda-gdb) quit
A debugging session is active.
        Inferior 1 [process 32589] will be killed.
Quit anyway? (y or n) y
NVbit
- If
predicateis nonzero,__ballotreturns a value with theNth bit set, whereNis the thread index.
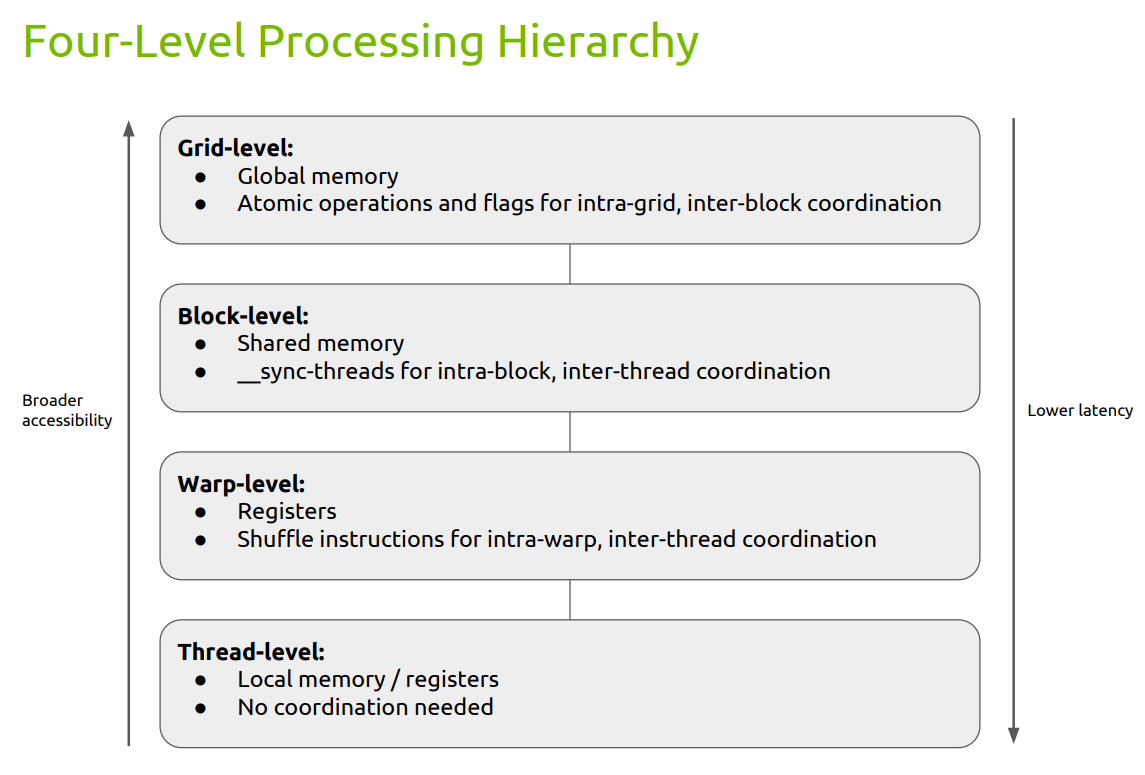
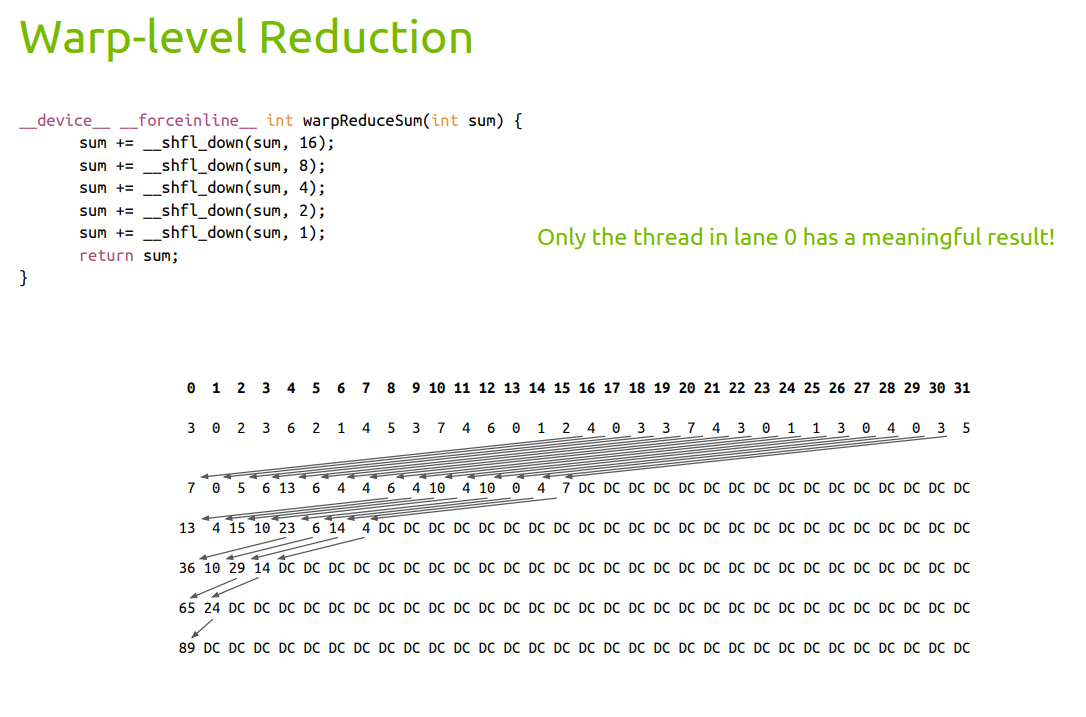
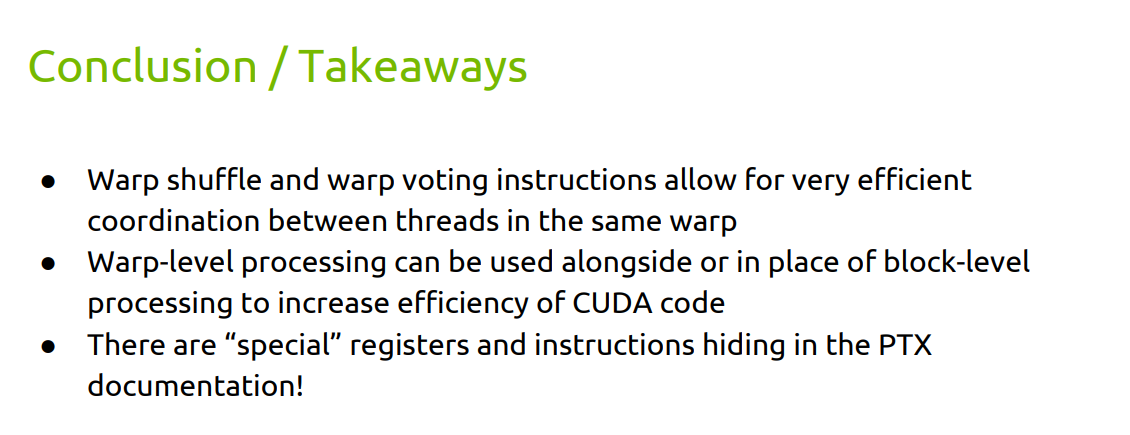
warp-level 指令
CSE 599 I Accelerated Computing - Programming GPUs Lecture 18.pdf (tschmidt23.github.io)
cuda SDK
- HPC benchmark NVIDIA HPC-Benchmarks | NVIDIA NGC